决策树概述
决策树决策树(decision tree)是一种基本的分类与回归方法,类似于下图的形式: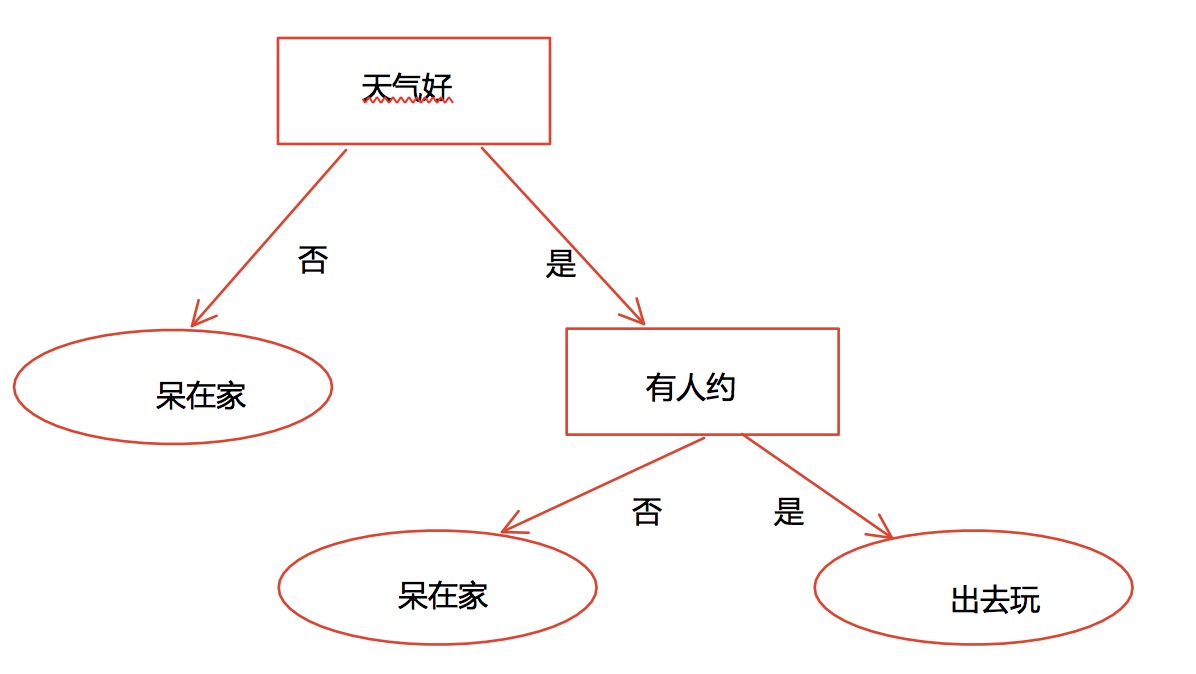
决策树由结点(node)和有向边(directed edge)组成。结点有两种类型:内部结点(internal node)和叶结点(leaf node)。内部结点表示一个特征或属性,叶结点表示一个分类。
由决策树的根结点(root node)到叶结点(leaf node)的每一条路径构建一条规则;路径上内部结点的特征对应着规则的条件,而叶结点的类对应着规则的结论。决策树根据数据集创建规则的过程就是机器学习的过程。
熵
关于决策树的一些基本知识,这里就不再赘述了,具体可以见之前的文章回归分析之决策树
决策树的构造
首先我们要考虑:当前数据集上哪个特征对划分数据分类有决定性作用。
为了找到这个特征,需要评估每个特征。完成测试后,原始数据集就会被划分为几个子集,分布在第一个决策点的所有分支上。如果某个分支下的数据都是同一分类的,那么无需继续划分,否则需要进一步对数据集进行分割。
特征选择
特征选择就是决定用哪个特征来划分特征空间。
我们可以用信息增益、信息增益比、基尼系数来作为特征划分准则。本文选取信息增益,通过计算各个特征的信息增益来选取信息增益最大的特征来进行数据集的划分。
这里引入一个信贷情况的例子:
| 年龄 | 有无工作 | 有无房子 | 信贷情况 | 是否给贷款 |
|---|---|---|---|---|
| 青年 | 无 | 无 | 一般 | 否 |
| 青年 | 无 | 无 | 好 | 否 |
| 青年 | 有 | 无 | 好 | 是 |
| 青年 | 有 | 有 | 一般 | 是 |
| 青年 | 无 | 无 | 一般 | 否 |
| 中年 | 无 | 无 | 一般 | 否 |
| 中年 | 无 | 无 | 好 | 否 |
| 中年 | 有 | 有 | 好 | 是 |
| 中年 | 无 | 有 | 非常好 | 是 |
| 中年 | 无 | 有 | 非常好 | 是 |
| 老年 | 无 | 有 | 非常好 | 是 |
| 老年 | 无 | 有 | 好 | 是 |
| 老年 | 有 | 无 | 好 | 是 |
| 老年 | 有 | 无 | 非常好 | 是 |
| 老年 | 无 | 无 | 一般 | 否 |
1.首先计算数据集的经验熵:1
2
3
4
5
6
7
8
9
10
11
12
13
14
15
16
17
18
19
20
21
22
23
24
25
26
27
28
29
30
31
32
33
34
35
36
37
38
39
40
41
42
43
44
45
46# -*- coding: UTF-8 -*-
from math import log
def creatDataSets():
# 青年:0;中年:1;老年:2
# 有工作:1;无工作:0
# 有房子:1;无房子:0
# 一般:0;好:1;非常好:2
# 给放贷:1;不给放贷:0
dataSet = [[0, 0, 0, 0, 'no'],
[0, 0, 0, 1, 'no'],
[0, 1, 0, 1, 'yes'],
[0, 1, 1, 0, 'yes'],
[0, 0, 0, 0, 'no'],
[1, 0, 0, 0, 'no'],
[1, 0, 0, 1, 'no'],
[1, 1, 1, 1, 'yes'],
[1, 0, 1, 2, 'yes'],
[1, 0, 1, 2, 'yes'],
[2, 0, 1, 2, 'yes'],
[2, 0, 1, 1, 'yes'],
[2, 1, 0, 1, 'yes'],
[2, 1, 0, 2, 'yes'],
[2, 0, 0, 0, 'no']]
labels = ['age','work','house','credit']
return dataSet,labels
def calcShannonEnt(dataSet):
numEntries = len(dataSet)
labelCounts = {}
for featVec in dataSet:
currentLabel = featVec[-1]
if currentLabel not in labelCounts.keys():
labelCounts[currentLabel] = 0
labelCounts[currentLabel] += 1
shannonEnt = 0.0
for key in labelCounts:
prob = float(labelCounts[key]) / numEntries
shannonEnt -= prob * log(prob,2)
return shannonEnt
if __name__ == '__main__':
dataSet,features = creatDataSets()
print(calcShannonEnt(dataSet))
# 0.9709505944546686
2.划分数据集
我们对每个特征划分数据集的结果计算一次信息熵,然后根据划分后的结果计算信息增益,判断哪个特征才是最好的。1
2
3
4
5
6
7
8
9
10
11
12
13
14
15
16
17
18"""
函数说明:按照给定特征划分数据集
Parameters:
dataSet - 待划分的数据集
feat_axis - 划分数据集的特征索引
value - 需要返回的特征的值
Returns:
retDataSet
"""
def splitDataSet(dataSet,feat_axis,value):
retDataSet = []
for featVec in dataSet:
if featVec[feat_axis] == value:
reduceFeatVec = featVec[:feat_axis]
reduceFeatVec.extend(featVec[feat_axis+1:])
retDataSet.append(reduceFeatVec)
return retDataSet
该函数输入一个数据集,需要划分的特征索引,以及特征值,返回一个划分后的子集。针对我们的例子,feat_axis =0,value =0,就是将当前数据集的是青年的数据划分出来。
3.计算各个特征的信息增益
特征A对训练数据集D的信息增益g(D,A),定义为集合D的经验熵H(D)与特征A给定条件下D的经验条件熵H(D|A)之差,即:1
2
3
4
5
6
7
8
9
10
11
12
13
14
15
16
17
18
19
20
21
22
23
24
25
26
27
28
29
30# 计算各个特征的信息增益,选择最大的作为划分特征
def bestFeature(dataSet):
numFeatures = len(dataSet[0]) - 1 # 特征数量
baseEntropy = calcShannonEnt(dataSet)
infoGain_dict = {}
for i in range(numFeatures):
newEntropy = 0.0
# 获取该特征的所有特征值
featVals = set([each[i] for each in dataSet])
for value in featVals:
subDataSet = splitDataSet(dataSet,i,value)
prob = len(subDataSet) / float(len(dataSet))
newEntropy += prob * calcShannonEnt(subDataSet)
infoGain = baseEntropy - newEntropy
print('第{0}个特征的信息增益是:{1}'.format(i,infoGain))
infoGain_dict[i] = infoGain #存储信息增益
sortedInfoGain = sorted(infoGain_dict.items(),key=operator.itemgetter(1),reverse = True)
bestFeat =sortedInfoGain[0][0]
print('最好的特征是第{0}个'.format(bestFeat))
if __name__ == '__main__':
dataSet,features = creatDataSets()
bestFeature(dataSet)
# 第0个特征的信息增益是:0.08300749985576883
# 第1个特征的信息增益是:0.32365019815155627
# 第2个特征的信息增益是:0.4199730940219749
# 第3个特征的信息增益是:0.36298956253708536
# 最好的特征是第2个
可以看到,针对我们的数据集,第二个特征是最好的,所以可以选择该特征进行划分。
构建决策树
我们已经学习了从数据集构造决策树算法所需要的子功能模块,包括经验熵的计算和最优特征的选择,其工作原理如下:得到原始数据集,然后基于最好的属性值划分数据集,由于特征值可能多于两个,因此可能存在大于两个分支的数据集划分。第一次划分之后,数据集被向下传递到树的分支的下一个结点。在这个结点上,我们可以再次划分数据。因此我们可以采用递归的原则处理数据集。
构建决策树的算法与很多,比如ID3、C4.5、CART等,其中ID3以信息增益作为特征划分准则。
这里我们实现一下ID3算法构建决策树。决策树以字典形式存储。1
2
3
4
5
6
7
8
9
10
11
12
13
14
15
16
17
18
19
20
21
22
23
24
25
26
27
28
29
30
31
32def majorityCnt(classList):
classCount = {}
for each in classList:
if each not in classCount.keys():
classCount[each] = 0
classCount[each] += 1
sortedClassCount = sorted(classCount.items(),key=operator.itemgetter(1),reverse=True)
return sortedClassCount[0][0]
def createTree(dataSet,label,featLabel):
classList = [each[-1] for each in dataSet] #取出所有的分类标签
if classList.count(classList[0]) ==len(classList): # 如果所有都是同一类,则停止划分
return classList[0]
if len(dataSet[0]) == 1: # 遍历完所有特征后返回出现次数最多的分类标签
return majorityCnt(classList)
bestFeat = bestFeature(dataSet) # 选择最优特征
bestFeatLabel = label[bestFeat] # 最优特征的标签
featLabel.append(bestFeatLabel) # 存储最优特征的标签
myTree = {bestFeatLabel: {}} # 根据最优特征的标签生成树
del(label[bestFeat]) # 删除已经使用特征标签
featValues = set([each[bestFeat] for each in dataSet]) # 该最优特征的所有特征值
for each in featValues:
subLabel = label[:]
myTree[bestFeatLabel][each] = createTree(splitDataSet(dataSet,bestFeat,each),subLabel)
return myTree
if __name__ == '__main__':
dataSet,features = creatDataSets()
bestFeature(dataSet)
myTree = createTree(dataSet,features)
print(myTree)
# {'house': {0: {'work': {0: 'no', 1: 'yes'}}, 1: 'yes'}}
决策树可视化
上面用字典形式表示了决策树,但是不直观,所以这里用Matplotlib库创建树形图。1
2
3
4
5
6
7
8
9
10
11
12
13
14
15
16
17
18
19
20
21
22
23
24
25
26
27
28
29
30
31
32
33
34
35
36
37
38
39
40
41
42
43
44
45
46
47
48
49
50
51
52
53
54
55
56
57
58
59
60
61
62
63
64
65
66
67
68
69
70
71
72
73
74
75
76
77
78
79
80
81
82
83
84
85
86
87
88
89
90
91
92
93
94
95
96
97
98
99
100
101
102from matplotlib.font_manager import FontProperties
import matplotlib.pyplot as plt
"""
函数说明:获取决策树叶子结点的数目
Parameters:
myTree - 决策树
Returns:
numLeafs - 决策树的叶子结点的数目
"""
def getNumLeafs(myTree):
numLeaf = 0 # 初始化叶子
firstStr = next(iter(myTree))
secondDict = myTree[firstStr]
for key in secondDict.keys():
# 测试该节点是否为字典,如果不是字典,代表该节点为叶子节点
if type(secondDict[key]).__name__ == 'dict':
numLeaf += getNumLeafs(secondDict[key])
else:
numLeaf += 1
return numLeaf
"""
函数说明:获取决策树的层数
Parameters:
myTree - 决策树
Returns:
maxDepth - 决策树的层数
"""
def getTreeDepth(myTree):
maxDepth = 0
firstStr = next(iter(myTree))
secondDict = myTree[firstStr]
for key in secondDict.keys():
if type(secondDict[key]).__name__ == 'dict':
thisDepth = 1+getTreeDepth(secondDict[key])
else:
thisDepth = 1
if thisDepth > maxDepth:
maxDepth = thisDepth
return maxDepth
"""
函数说明:绘制结点
Parameters:
nodeTxt - 结点名
centerPt - 文本位置
parentPt - 标注的箭头位置
nodeType - 结点格式
Returns:
无
"""
def plotNode(nodeTxt,centerPt,parentPt,nodeType):
arrow_args = dict(arrowstyle='<-') # 定义箭头格式
font = FontProperties(fname='/System/Library/Fonts/STHeiti Light.ttc',size=14) # 设置中文字体
# 绘制节点
createPlot.ax1.annotate(nodeTxt, xy=parentPt, xycoords='axes fraction',\
xytext=centerPt, textcoords='axes fraction',\
va="center", ha="center", bbox=nodeType, arrowprops=arrow_args, FontProperties=font)
def plotMidText(cntrPt,parentPt,txtString):
xMid = (parentPt[0]-cntrPt[0])/2.0 +cntrPt[0]
yMid = (parentPt[1]-cntrPt[1])/2.0 +cntrPt[1]
createPlot.ax1.text(xMid,yMid,txtString,va='center',ha='center',rotation=30)
def plotTree(myTree,parentPt,nodeTxt):
decisionNode = dict(boxstyle='sawtooth',fc='0.8')
leafNode = dict(boxstyle='rountr4',fc='0.8')
numLeafs = getNumLeafs(myTree)
depth = getTreeDepth(myTree)
firstStr = next(iter(myTree))
cntrPt = (plotTree.xOff + (1.0 +float(numLeafs))/2.0/plotTree.totalW,plotTree.yOff)
plotMidText(cntrPt,parentPt,nodeTxt)
plotNode(firstStr,cntrPt,parentPt,decisionNode)
secondDict = myTree[firstStr]
plotTree.yOff = plotTree.yOff-1.0/plotTree.totalD
for key in secondDict.keys():
if type(secondDict[key]).__name__ == 'dict':
plotTree(secondDict[key],cntrPt,str(key))
else:
plotTree.xOff = plotTree.xOff +1.0/plotTree.totalW
plotNode(secondDict[key], (plotTree.xOff, plotTree.yOff), cntrPt, leafNode)
plotMidText((plotTree.xOff, plotTree.yOff), cntrPt, str(key))
plotTree.yOff = plotTree.yOff + 1.0/plotTree.totalD
def createPlot(inTree):
fig = plt.figure(1,facecolor='white')
fig.clf()
axprops = dict(xticks=[],yticks=[])
createPlot.ax1 = plt.subplot(111,frameon=False,**axprops)
plotTree.totalW = float(getNumLeafs(inTree))
plotTree.totalD = float(getTreeDepth(inTree))
plotTree.xOff = -0.5/plotTree.totalW
plotTree.yOff = 1.0
plotTree(inTree,(0.5,1.0),'test')
plt.show()
绘制出来的结果如下图: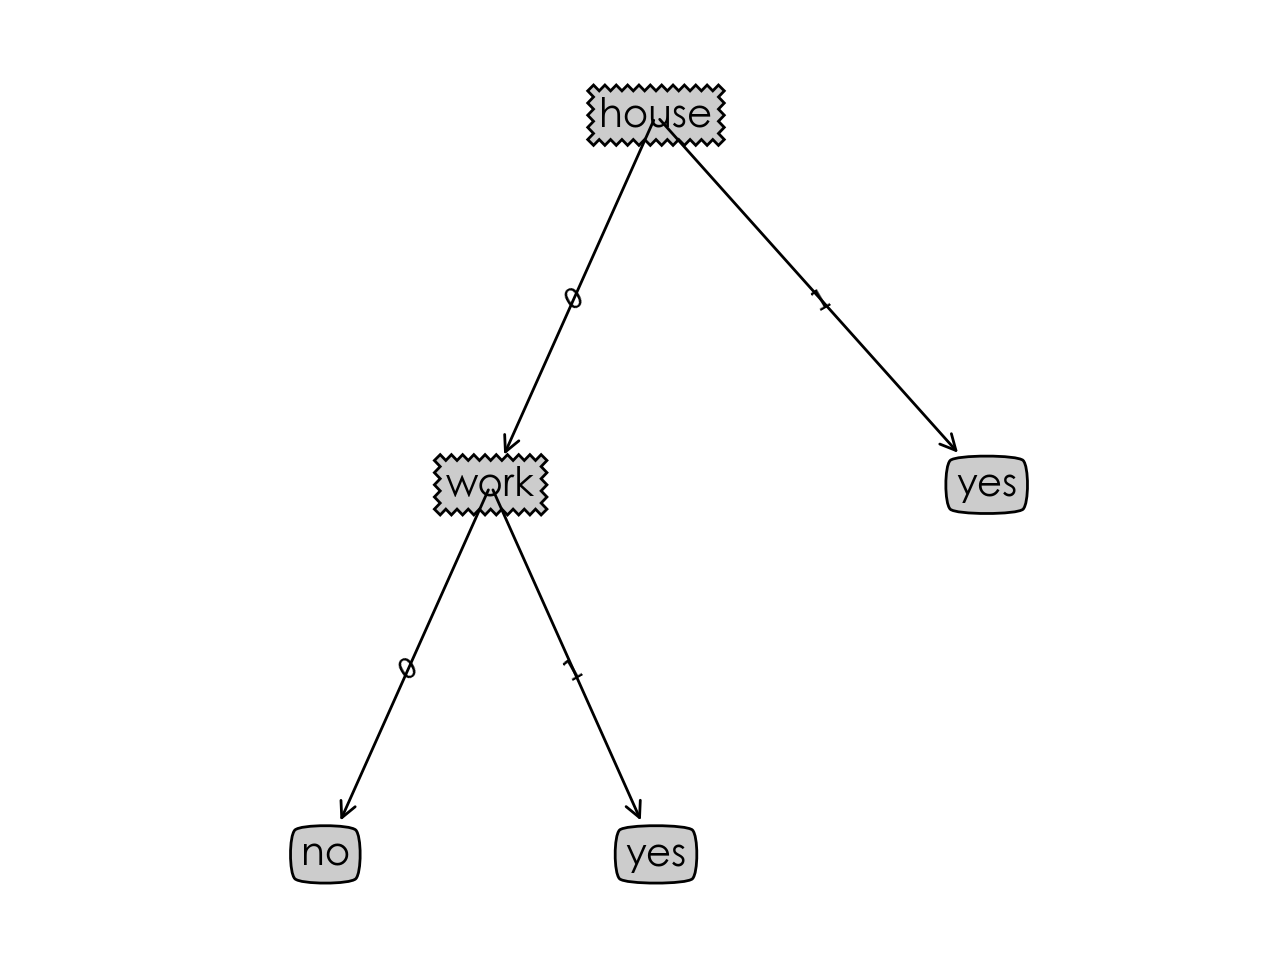
这部分画图内容感觉有点难…但是后续会有更简单的方法,所以也不必担心。
使用决策树进行分类
这一部分其实和上面的画图没什么联系,只需要用到之前训练好的决策树字典就行。1
2
3
4
5
6
7
8
9
10
11
12
13
14
15
16
17
18
19
20
21"""
函数说明:使用决策树分类
Parameters:
inputTree - 已经生成的决策树
featLabels - 存储选择的最优特征标签
testVec - 测试数据列表,顺序对应最优特征标签
Returns:
classLabel - 分类结果
"""
def classify(inputTree,featLabel,testVec):
firstStr = next(iter(inputTree))
secondDict = inputTree[firstStr]
featIndex = featLabel.index(firstStr)
for key in secondDict.keys():
if testVec[featIndex] == key:
if type(secondDict[key]).__name__ == 'dict':
classLabel = classfy(secondDict[key],featLabel,testVec)
else:
classLabel = secondDict[key]
return classLabel
这里的决策树只由两个因素影响,work和house,所以在测试时只需要输入这两个特征的值即可1
2
3
4
5
6
7
8
9
10
11if __name__ == '__main__':
dataSet,features = creatDataSets()
featLabel = []
bestFeature(dataSet)
myTree = createTree(dataSet,features,featLabel)
#print(myTree)
#treePlotter.createPlot(myTree)
testVec = [0,1]
result = classify(myTree,featLabel,testVec)
print(result)
# yes
决策树的存储与读取
我们需要将构建好的决策树存储起来,方便分类时使用。1
2
3def storeTree(inputTree,filename):
with open(filename,'wb') as f:
pickle.dump(inputTree,f)
读取决策树:1
2
3def grabTree(filename):
f = open(filename,'rb')
return pickle.load(f)
一点说明
构建决策树完整代码见decisionTree.py
决策树可视化代码见treePlotter.py