实验目的
本实验的目的是爬取中国空气质量在线监测分析平台,按年份抓取某城市的空气质量历史数据。
实验环境
Chrome+ChromeDriver
python3
主要用到selenium、pyquery、pandas等库
爬取分析
本次实验以北京为例,点开该城市,发现是按月统计空气质量指数的:
如果想要查看具体某一天的数据,则需要点进该月,查看当天的空气质量指数数据,如果我们想要清楚的看到某一年份,每一天的空气情况,则需要对信息进行汇总。
以2017年为例,需要分别点进每月,查看该月的数据。
2017年1月的URL:https://www.aqistudy.cn/historydata/daydata.php?city=%E5%8C%97%E4%BA%AC&month=2017-01
2017年2月的URL:https://www.aqistudy.cn/historydata/daydata.php?city=%E5%8C%97%E4%BA%AC&month=2017-02
2017年3月的URL:https://www.aqistudy.cn/historydata/daydata.php?city=%E5%8C%97%E4%BA%AC&month=2017-03
如果想要获取某月的数据,只要增加一个month参数即可。
观察网页结构,查看开发者工具发现我们想要爬取的数据位于table元素块中: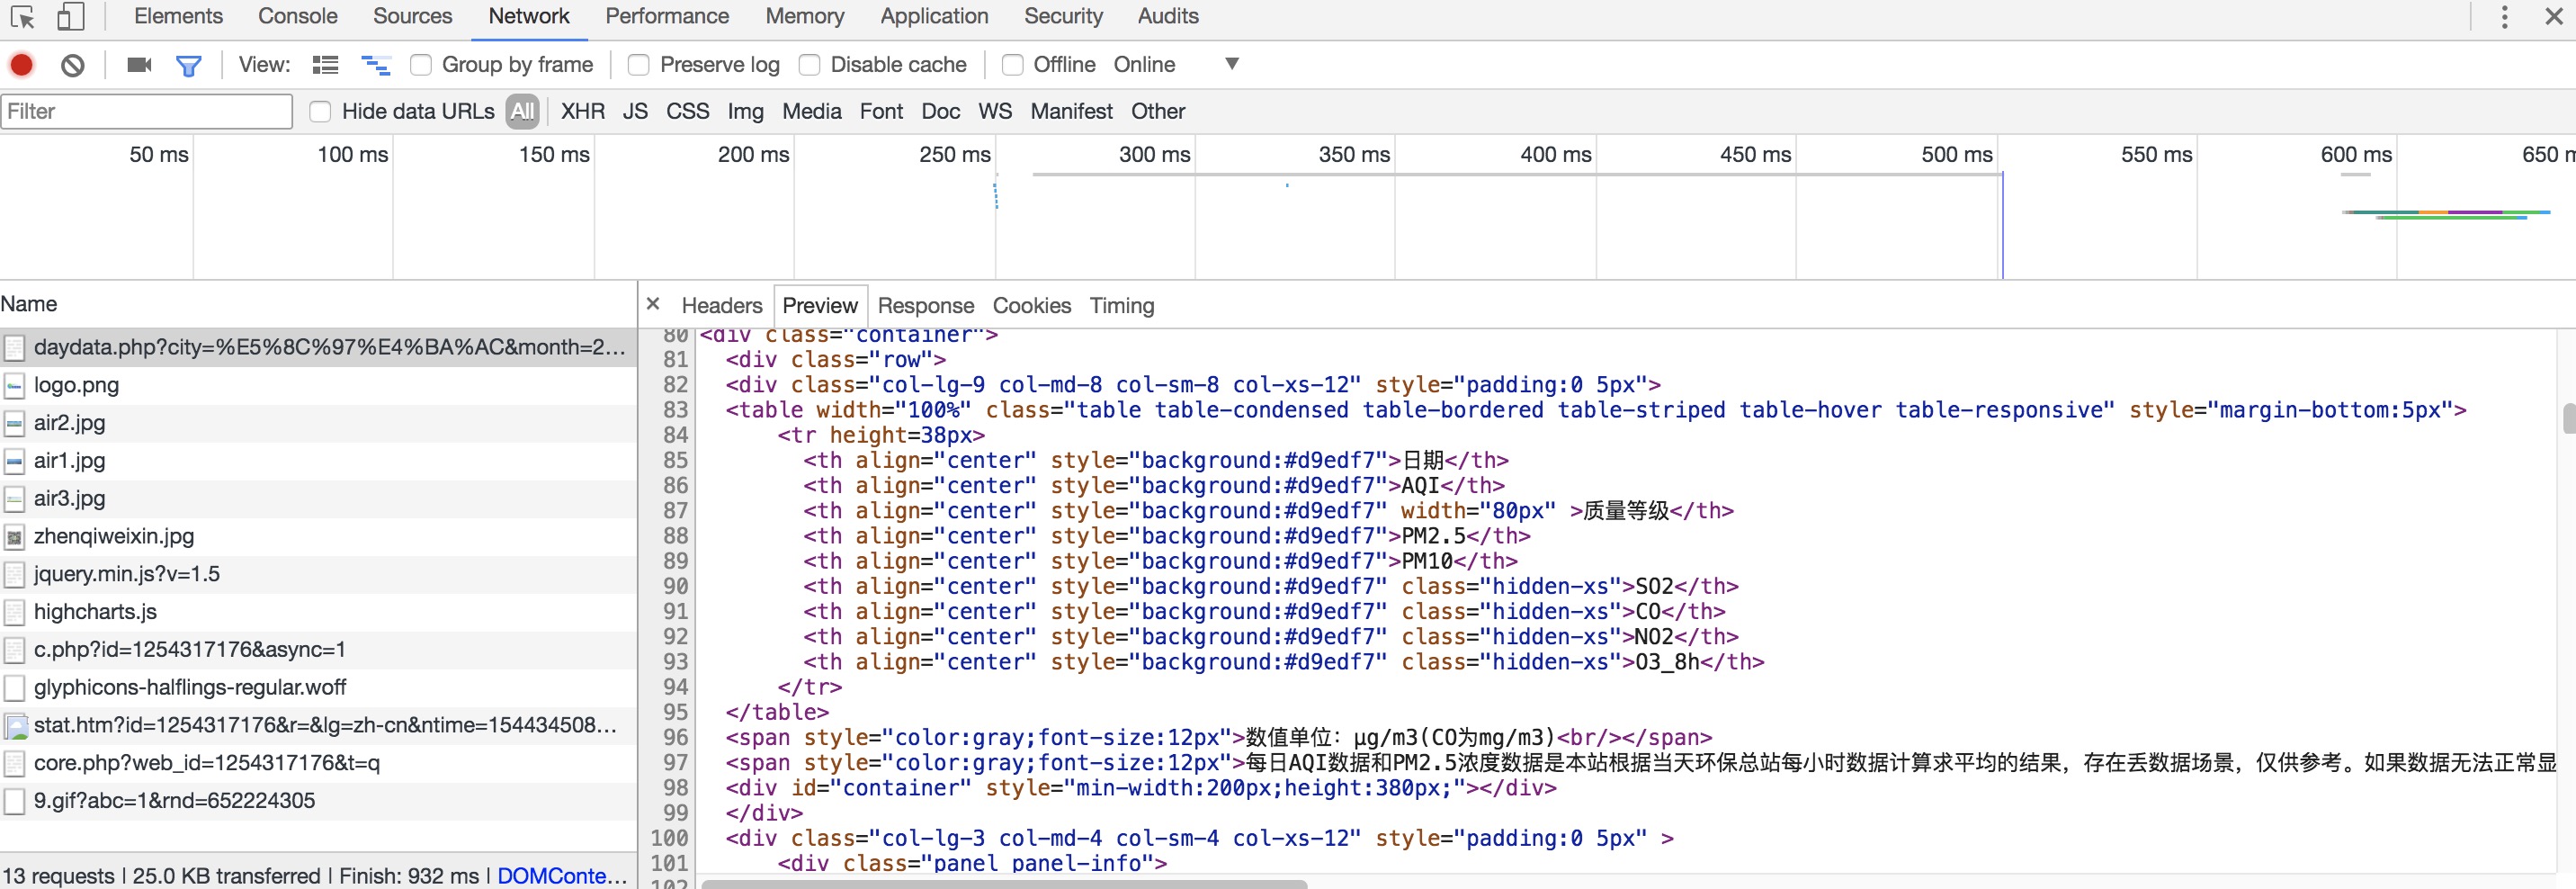
但是网页数据是随着时间进行变化的,属于动态页面,数据并不是直接展示在页面源码中,所以我们这里采用selenium来模拟浏览器,抓取数据。
实验步骤
ChromeDriver模拟浏览器
1 | # Chrome Driver 设置 |
接下来,使用browser.get()就可以对每一页发起请求。
获取每月的数据
这里用一个for循环对12个月分别发起请求,只需要改变month参数1
browser.get('https://www.aqistudy.cn/historydata/daydata.php?city=%E5%8C%97%E4%BA%AC&month={0}-{1}'.format(year, '%02d' % month))
观察页面结构,可以发现,要爬取的空气质量数据位于container元素块中:
1
2
3
4
5
6
7
8
9
10
11
12
13
14
15
16
17
18
19
20wait.until(EC.presence_of_element_located((By.CSS_SELECTOR, '#piecontainer .highcharts-container svg')))
table_pq = pq(browser.find_element_by_css_selector('.container table').get_attribute('innerHTML'))
for tr in table_pq.find('tr').items():
if tr == table_pq.find('tr').eq(0):
continue
result.append({
'date': tr.find('td:nth-child(1)').text(),
'AQI': tr.find('td:nth-child(2)').text(),
'rank': tr.find('td:nth-child(3)').text(),
'PM2.5': tr.find('td:nth-child(4)').text(),
'PM10': tr.find('td:nth-child(5)').text(),
'SO2': tr.find('td:nth-child(6)').text(),
'CO': tr.find('td:nth-child(7)').text(),
'NO2': tr.find('td:nth-child(8)').text(),
'O3_8h': tr.find('td:nth-child(9)').text()
})
存储数据
获取到该年份每个月的空气质量数据后,将结果保存为excel:1
2
3df = pandas.DataFrame(result)
df.to_excel('%s.xls' % year, columns=['date', 'AQI', 'rank', 'PM2.5', 'PM10', 'SO2', 'CO', 'NO2', 'O3_8h'])
#print(result)
结果说明
完整代码见pm2.5.py
运行代码,以2017年为例:1
python pm2.5.py 2017
生成2017.xls: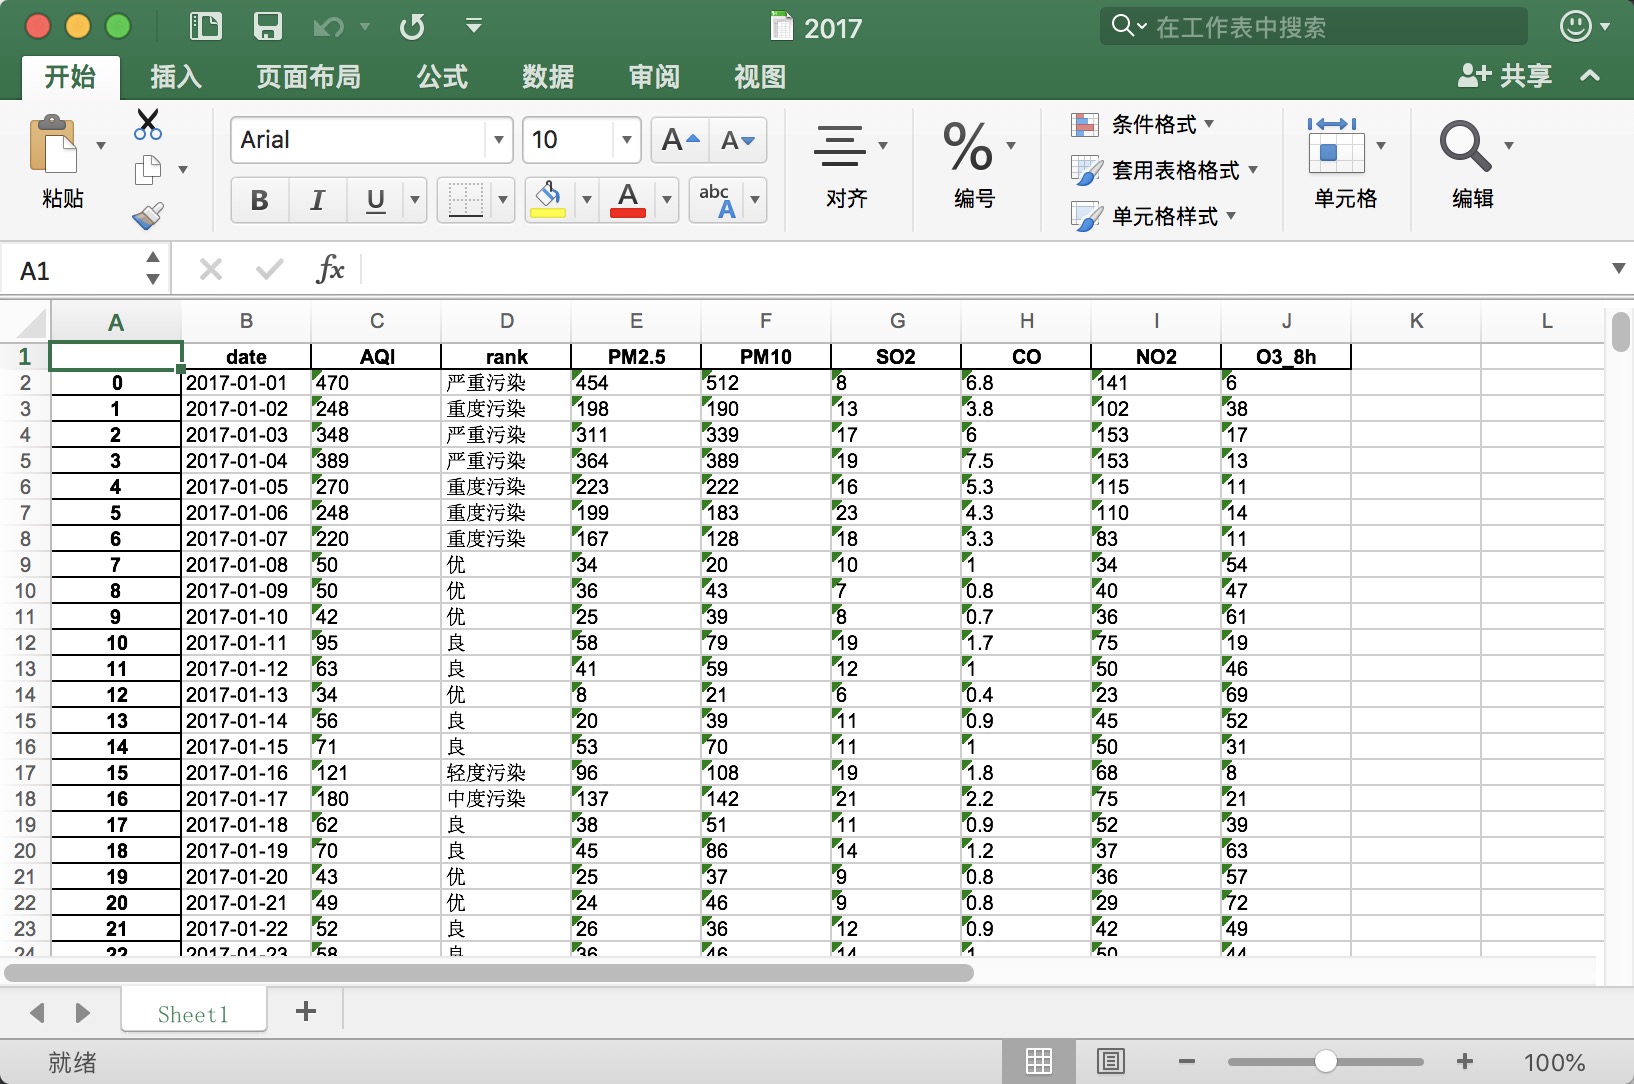
说明:如果想要获取其他城市的年数据,修改city参数即可。